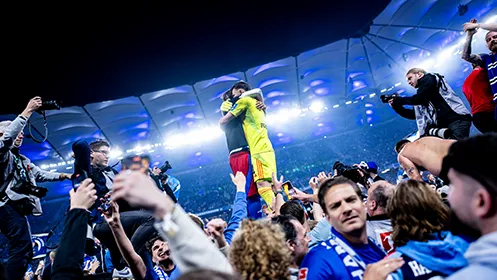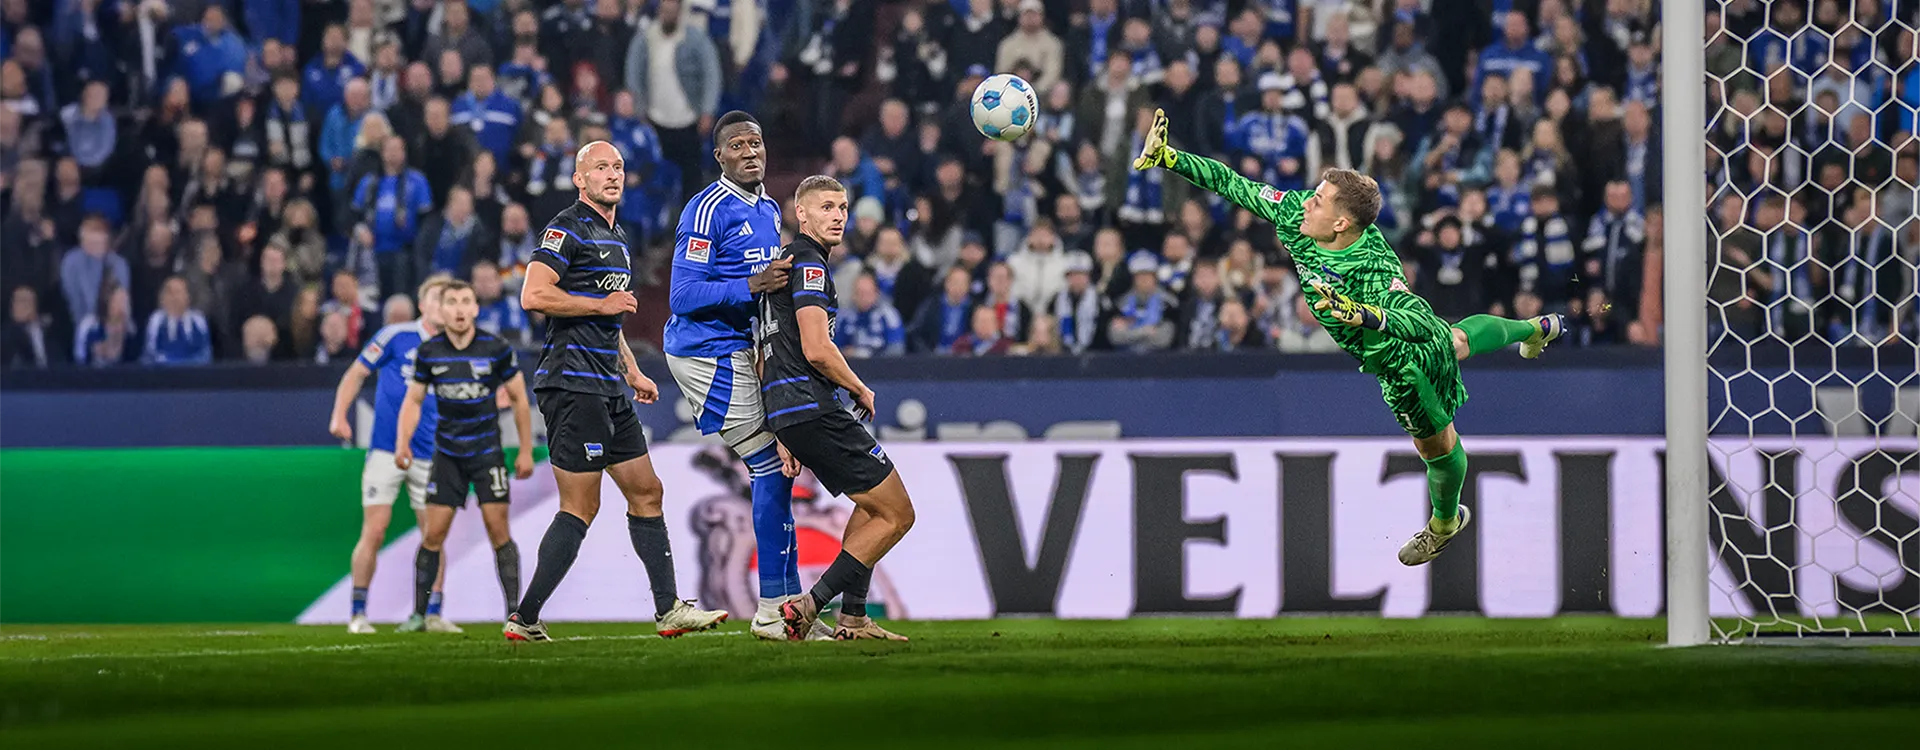
Examining the correlation between the economic conditions of the clubs and their sporting success reveals that the six clubs in the top third of the table recorded only marginally higher revenues and expenses than the average club. The most successful clubs achieved 13 per cent more revenue and costs than the average; clubs in mid table reached 109 per cent and 110 per cent, respectively. The bottom third recorded 78 per cent revenue and 77 per cent expenses.
2024-2025 |
Match revenue |
Advertising |
Media revenue |
Transfers |
Merchandising |
Other |
Total |
|||||||
|---|---|---|---|---|---|---|---|---|---|---|---|---|---|---|
Positions 1-6 |
17,403 |
115% |
15,114 |
126% |
17,704 |
111% |
7,160 |
81% |
7,865 |
147% |
10,730 |
110% |
75,975 |
113% |
Positions 7-12 |
15,077 |
99% |
10,404 |
86% |
17,352 |
108% |
15,844 |
180% |
4,965 |
93% |
9,749 |
100% |
73,392 |
109% |
Positions 13-18 |
13,090 |
86% |
10,572 |
88% |
12,989 |
81% |
3,452 |
39% |
3,242 |
61% |
8,710 |
90% |
52,055 |
78% |
BL 2 average |
15,190 |
100% |
12,030 |
100% |
16,015 |
100% |
8,819 |
100% |
5,357 |
100% |
9,730 |
100% |
67,141 |
100% |
2024-2025 |
|
Administrative staff |
Transfers |
Match operations |
Youth/women |
Other |
Total |
|||||||
|---|---|---|---|---|---|---|---|---|---|---|---|---|---|---|
Positions 1-6 |
18,179 |
110% |
7,767 |
112% |
5,320 |
85% |
16,428 |
125% |
5,456 |
132% |
20,653 |
111% |
73,802 |
113% |
Positions 7-12 |
18,357 |
111% |
6,980 |
101% |
10,787 |
173% |
13,816 |
105% |
4,192 |
102% |
18,041 |
97% |
72,172 |
110% |
Positions 13-18 |
12,949 |
79% |
5,990 |
87% |
2,607 |
42% |
9,292 |
71% |
2,726 |
66% |
16,975 |
91% |
50,539 |
77% |
BL 2 average |
16,495 |
100% |
6,912 |
100% |
6,238 |
100% |
13,179 |
100% |
4,125 |
100% |
18,556 |
100% |
65,504 |
100% |